
SEO, Google Ads & Local Services Ads
Connecting HVAC enquiries to reported revenue.
A Central Valley HVAC company combined a new website, SEO, Google Ads and Local Services Ads. Its January-to-October report recorded 997 leads and $802,811 in attributed revenue across those channels.
- reported leads
- 997
- listed marketing spend
- $78,133.17
- attributed revenue
- $802,811
The business question
The useful question was not simply how many people clicked an ad. The company needed to connect enquiries with the jobs and revenue recorded in its business systems.
The work
AMÁRQUEZ's campaign account describes a new website alongside SEO, paid search and Local Services Ads. CallRail was connected with Housecall Pro to help relate incoming leads to revenue by channel.
What the report shows
SEO recorded the largest lead count in this report, while Google Ads recorded the largest attributed revenue total. Looking at those measures together gives a more useful picture than comparing lead cost alone.
The listed revenue divided by the listed spend is 10.27 times. This is a revenue-to-marketing-spend ratio, not profit ROI. Labour, materials, overhead and other business costs are not included in that calculation.
The figures
| Channel | Leads | Listed spend | Attributed revenue |
|---|---|---|---|
| Google Ads | 231 | $37,403.34 | $299,431 |
| Local Services Ads | 281 | $15,729.83 | $262,380 |
| SEO | 485 | $25,000.00 | $241,000 |
| Total | 997 | $78,133.17 | $802,811 |
Source figures
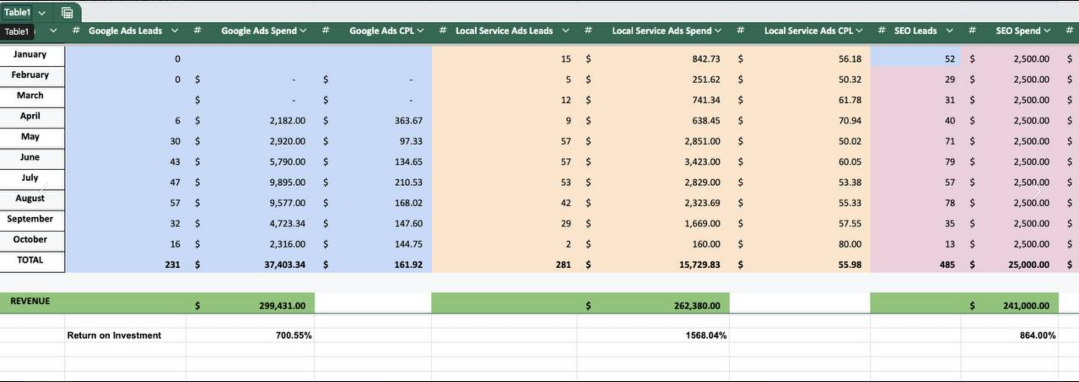
About the report
Reporting period: January to October; the source report does not state the year.
Source: AMÁRQUEZ's supplied HVAC channel report and campaign account. The spreadsheet lists January through October but does not identify a year.
These are the report's lead and attribution totals. They are not a count of confirmed unique customers or a controlled measure of incremental revenue. The original report uses an ROI label; this page uses attributed revenue and revenue-to-spend terminology to avoid presenting revenue as profit.