
A local ranking grid measures the same search from several locations.
It can show strong visibility around an office and weaker positions elsewhere. Read the individual points alongside the average and the share of points in the top three. None of those measures, on its own, tells you how many people enquired or became customers.
Why can two people in Fresno see different results?
Local results depend in part on where the searcher is. Google describes relevance, distance and prominence as the main local-ranking factors. A business that matches the query well is still competing within a geographic context. See Google's local ranking guidance.
A search from your office answers one narrow question. A grid samples a wider set of locations for a specified term and business. It is still a tool-based observation rather than a recording of every customer's screen. Local Falcon notes that browser context and map zoom can produce different results.
Read the report before reading the colors
Below is the Nelson-Dye Remodeling Specialists report for “remodel fresno”, comparing July 6 and August 3, 2025. Each displayed grid has 13 rows and 13 columns: 169 sampled positions. The screenshot identifies the business, term and dates; it does not document every scan setting or the work performed between scans.
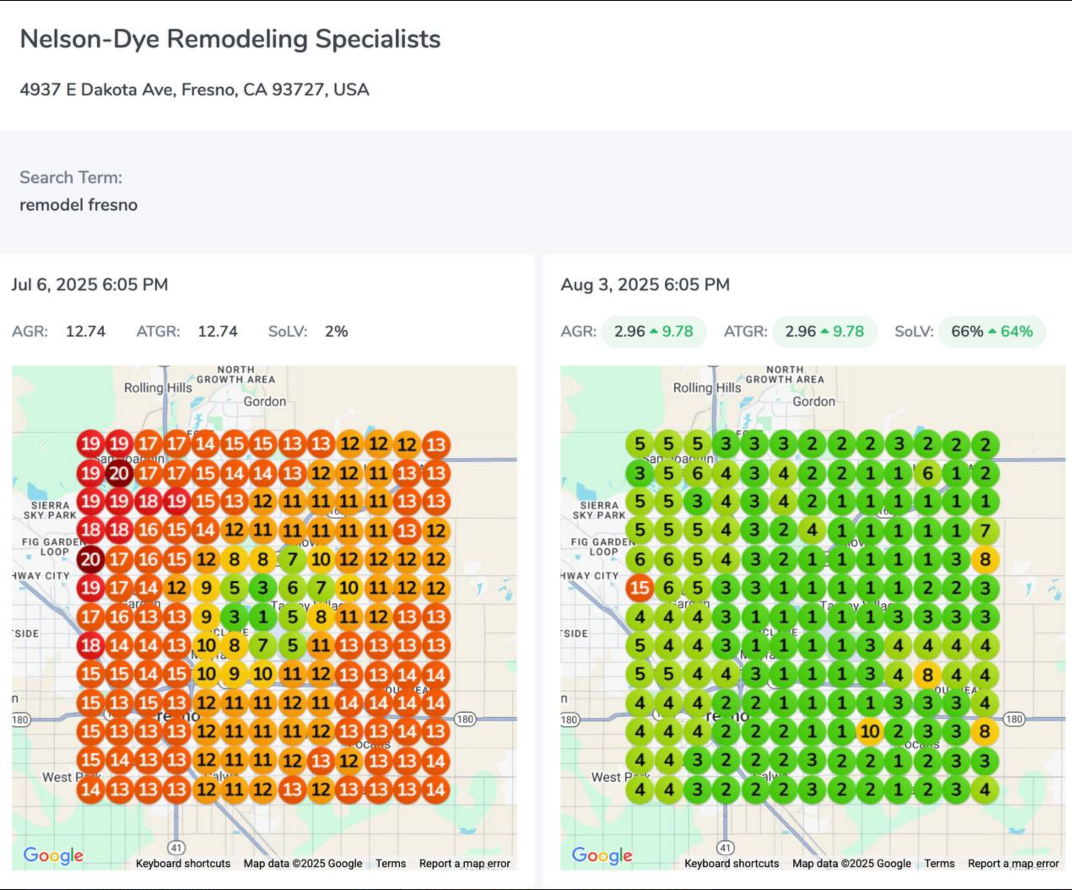
Start with three observations. The July grid has many positions in the teens and a small stronger area. The August grid contains many more 1s, 2s and 3s. It also still contains points marked 8, 10 and 15. The change is broad, but “top three everywhere” would be an inaccurate reading.
What do the average and SoLV actually mean?
The historical report labels its average AGR, which the supplied case describes as average grid rank. Lower is better. The reported movement from 12.74 to 2.96 summarizes many locations; it does not mean each location now ranks third.
Share of Local Voice, or SoLV, describes the percentage of sampled grid points where the business ranks in the top three for that term. It is not the share of all Fresno searches, people or revenue. Local Falcon defines this measure in its ranking-metric guidance, which currently uses ARP and ATRP labels for its averages. Keep the historical report's AGR label when discussing these figures, and confirm how a tool handles unranked points before comparing averages across products.
| Measure | Reported change | Useful interpretation |
|---|---|---|
| Average grid rank | 12.74 to 2.96 | The summary position improved; individual locations still differ. |
| SoLV | 2% to 66% | Top-three coverage increased by 64 percentage points across the sampled grid. |
| Leads and booked projects | Not supplied by this grid | Separate enquiry and sales records are needed. |
At the later scan, about two-thirds of the sampled positions were in the top three. Roughly one-third were not. Those are rounded report percentages, so they should not be converted into an exact count of winning cells. Nor is this a claim that 66% of residents saw the business: evenly spaced sample points do not weight neighborhoods by customer demand.
Why does the service term matter?
Nelson-Dye's other reports tell a different story for each service search. On August 3, average grid rank was 3.95 for “kitchen remodel fresno” and 4.71 for “bathroom remodel”, compared with 2.96 for “remodel fresno”. Their reported SoLV values were 49%, 38% and 66% respectively. See the complete three-term case study.
A single broad remodeling average would hide that variation. If bathroom work is a business priority, the relevant question is whether visibility for bathroom searches improves in the places where suitable projects come from. The map cannot tell us whether the business actually wants more of that work; that requires a commercial decision.
Is the next scan a fair comparison?
Ask for the exact query, business listing, search platform, grid center, point spacing, covered area and any disabled points, along with the date. Keep those settings consistent for a trend. A tighter grid around the strongest area may improve an average without demonstrating improvement across the previous footprint.
The supplied Nelson-Dye images show the same named business, matching terms and displayed grid sizes. They do not independently establish all settings or isolate a cause. Do not assign the change to a review campaign, a page edit or another tactic without a verified work record and more evidence.
How should the map change the next decision?
Choose a service and part of the real service area that matter to the business. Inspect the weaker points and the businesses appearing there. Review whether your profile and website describe that service accurately, and whether relevant project evidence helps a prospective customer choose you. Record the hypothesis before making changes.
Then pair later scans with separately measured enquiries and suitable projects. More green points with unchanged qualified enquiries is a reason to examine demand, message, measurement and the next step on the website. It is not evidence that every extra impression became a lead.
Bring the dated grid and your project priorities to a discussion about local SEO. For local context, explore SEO in Fresno and marketing for remodeling businesses. The useful outcome is a decision about the work to test next, with a record that makes the next report comparable.